View Compensated Studies
 View Studies by Health Condition


Underperforming patient recruitment has been a long-time problem for clinical trials. Ninety percent of worldwide clinical trials are delayed due to under-performing patient recruitment. Study timelines are typically extended to nearly double their original duration to meet desired enrollment levels for all therapeutic areas. In addition to delayed timelines, 37% of sites do not meet their enrollment target, while 11% of sites fail to enroll a single patient.
There are many reasons why clinical trial recruitment is difficult. For one, people have a poor awareness of clinical trials—less than one in three people have heard of clinical trials, and less than one in 20 know how to find out more about clinical trials. Then, there are reasons like poor public perception of clinical trials, as well as increasing numbers of trials and consequent higher competition for patients. There’s also the increasing complexity of protocols, which leads to an increase in eligibility criteria that decreases the chances of successful enrollment.
And while all the aforementioned reasons are known and foreseeable, researchers are still struggling with enrollment forecasting.
So what can you do to improve?
The Impact of Cognitive Bias on Forecasting
While humans are exceptionally good at the physical act of throwing and, more importantly, at pattern recognition, we have a major shortcoming when it comes to accurate forecasting: cognitive bias.
Cognitive bias is a mistake in reasoning, evaluating, remembering, or another cognitive process, often occurring as a result of holding on to one’s preferences and beliefs regardless of contrary information. And in order to successfully forecast enrollment numbers, we need to first acknowledge and overcome a specific cognitive bias that prevents us from accurately predicting the future.
Optimism Bias
Optimism bias is a cognitive bias that causes us to be far too optimistic when considering future possibilities. For example, divorce rates in the western world hover at around 40%; however, when you ask newlyweds to rate their own likelihood of divorce, they more than likely put the figure at 0%.
Like most characteristics of the human brain, optimism bias has an important benefit: it helps us take action, which, from an evolutionary perspective, is helpful for survival. However, like all cognitive biases, optimism bias has significant downsides that might lead to irrational decisions.
Ramifications of Optimism Bias in Clinical Trial Recruitment
Optimism bias can lead to poor decision-making in clinical trial recruitment, particularly when it comes to resource allocation.
At the research site level, optimism bias leads to underutilized staff, which is often the biggest expense of a clinical trial.
Here’s an example—let’s say you’re a research site allocating studies to staff based on an overly optimistic patient enrollment forecast. Not only will your staff be underutilized, but on an economic level, you’re losing in several different ways:
- Low enrollment rates – Less patients will enroll in your study, which means less revenue;
- Losing out on an economies of scale basis – While it makes sense to take on certain studies for which you can recruit a specific number of patients, some of these studies might not be worthwhile if you recruit a lesser number. If your forecast is too optimistic, then that study may not actually be worth taking on. This is one of the major reasons for high turnover of investigator sites and why 40% only ever participate in one study; and,
- Over-promising and under-delivering – under-delivering hurts your reputation and diminishes your chance of being asked to participate in future trials (especially profitable ones).
At the sponsor level, delays in recruitment equal loss of revenue from the sale of a specific drug or device. All this because researchers believe that their clinical trial will not experience the same recruitment problems other trials have faced before—and that is the core issue with the optimism bias in clinical trial recruitment.
For grant-funded research, recruitment delays jeopardize the research effort, as you may run out of funding before reaching your target sample size, or have to amend the eligibility criteria to meet your enrollment goal.
The “Wait-and-See” Approach
Whether it’s from advertising or bringing on additional investigator sites, optimism bias leads to poor allocation of budgets to assist in recruitment and leads to something we call the “wait and see” approach.
The “wait-and-see” approach occurs when researchers are aware that 90% of clinical trials are delayed due to recruitment, but they assume their clinical trial will be in the 10% of trials that will not be delayed. This assumption results in significantly delayed timelines, overspending on expensive last-minute advertising, weakening of the eligibility criteria or sample size, or a combination of the above.
Overcoming Optimism Bias
Is the mere awareness of optimism bias enough to prevent its ramifications? Unfortunately not.
The knowledge that 90% of clinical trials are delayed due to patient recruitment has little effect on whether or not a researcher might fall prey to optimism bias. In fact, we’re very bad at avoiding skirting optimism bias in our everyday lives as well—according to neuroscientist Tali Sharot, roughly 80% of us experience optimism bias with regards to our own life.
(And if you think you’re in the 20%, you should read this article again!)
But being overly pessimistic does not solve the problem. Even when we try to be pessimistic, our forecasts and estimates still come out more optimistic than in reality. The key to overcoming optimism bias, Tali Sharot concludes, is to learn how to protect ourselves from dangers of optimism while also benefiting from its fruits.
And in the case of clinical trial recruitment, it is to remove the ability to estimate based on intuition or gut feel, which is done by instead relying solely on data.
Data Doesn’t Lie
In the words of Jay Samit, Independent Vice Chairman of Deloitte:
“Data may disappoint, but it never lies.”
At Trialfacts, we’ve recruited for hundreds of studies in Australia and the United States for over 10 years. We’ve been collecting information on what proportion of patients drop out at each stage of the typical enrollment funnel, and our data matches up very closely with the same data collected by other organizations. And because of our experience and research, we’ve been able to accurately model the enrollment funnel based on data, and assess specific recruitment strategies for time, cost, and patients recruited.
In the following sections, we’ll take a closer look at how we model our enrollment funnels based on data, allowing us to overcome our optimism bias and focus solely on the facts.
Average Dropout Rates at Each Recruitment Stage
Below is a table representing the average patient drop-out rate for each of the different stages of recruitment.
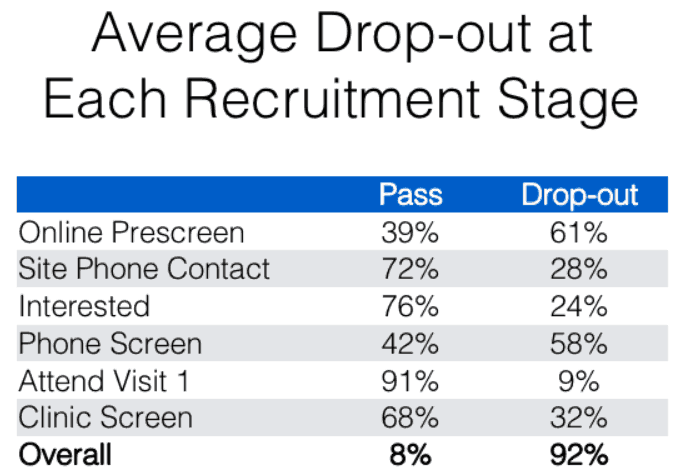
Source: Trialfacts
Based on the drop-out rates in this graph, the enrollment funnel for an average study requiring 10 patients would look like this:
![]()
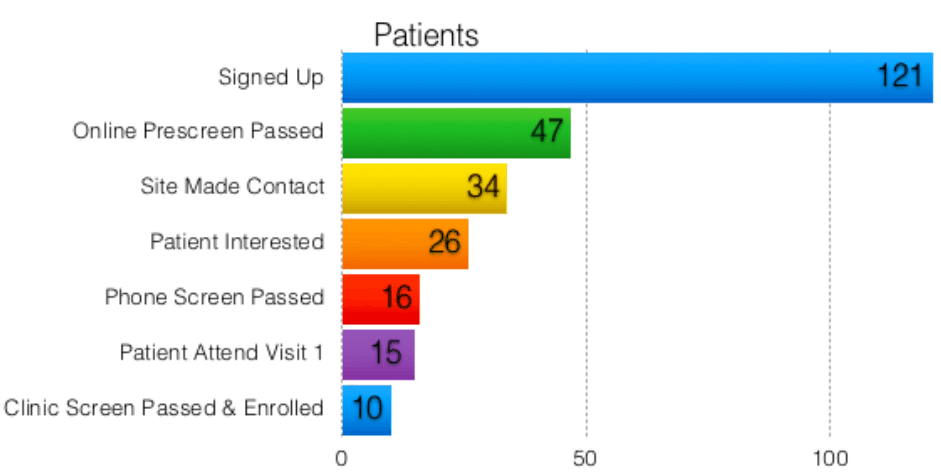
Source: Trialfacts
Based on the graph above, for an average study requiring 10 enrollments, you would need to generate about 120 inquiries from your recruitment strategies. So, a good rule of thumb for an easy, straightforward study, is that you would need to generate about 12 inquiries to randomize one patient.
However, this data is of limited use. How do you know if your study is an average one? What do you do if your study is more difficult than the average study?
Below, we’ll look at another example that compares what we would consider an average study with a more difficult one.
Average vs Difficult Recruitment Example
Below, you’ll see two graphs. The first is the same graph from the previous slide, which represents the enrollment funnel for 10 randomized patients for an average study. The second graph represents the enrollment funnel from a more difficult study we’ve recruited for at Trialfacts:


Source: Trialfacts
The difference between these two studies was the eligibility criteria. Eligibility for the difficult recruitment example (bottom graph) was more stringent, and to a lesser extent, the study was also slightly less appealing to potential participants.
And even though the second graph looks very similar to the first graph overall, the scale is very different—the bottom graph represents the more difficult criteria, and slightly less appealing nature of the study, which resulted in needing over 3,000 patient inquiries to gain 10 randomizations.
It’s easy to look at the protocol for a more difficult study (like the second study in our previous example) and think that if the eligibility criteria are stricter and the study is less appealing, it might only be twice as hard to recruit. However, in the case of our previous example, it’s not a matter of a study being twice or three times as hard to recruit for as an average study—it’s eight times as difficult. And that makes a very big difference.
This difference is mainly due to the nonlinear nature of the recruitment funnel, where there is a multiplicative effect: the higher drop-out rates at the Interested, Phone Screening and Clinic Screening stages are multiplied.
Building a Data-Driven Enrollment Funnel
When it comes to enrollment forecasting for clinical trials, data is king.
A data-driven recruitment funnel allows you to accurately forecast how many inquiries you would need at top of your enrollment funnel in order to hit your enrollment goal. This data-driven approach allows you to avoid optimism bias and its potential effect on your enrollment forecast, as we mentioned earlier on in the article.
Without a data-driven approach, your recruitment strategy falls into the “wait-and-see” type of recruitment, which is inefficient and unsuccessful.
If you want to find out how many inquiries you would need to successfully recruit for your study, contact us and we will go through our Due Diligence process free of charge!